Rv0700 (rpsJ)
Current annotations:
TBCAP: (community-based annotations - see table at bottom of page )
TBDB: 30S ribosomal protein S10
REFSEQ: 30S ribosomal protein S10
PATRIC: SSU ribosomal protein S10p (S20e)
TUBERCULIST: 30S ribosomal protein S10 RpsJ (transcription antitermination factor NusE)
NCBI: 30S ribosomal protein S10 RpsJ (transcription antitermination factor NusE)
updated information (H37Rv4):
gene name: rpsJ
function:
reference:
Coordinates in H37Rv: 800487 - 800792
Gene length: 306 bp (with stop codon), 101 aa (without stop codon)
Operon:
Trans-membrane region:
Role: II.A.1 - Ribosomal protein synthesis and modification
GO terms:
Reaction(s) (based on iSM810 metabolic model):
Gene Expression Profile Gene Modules Orthologs among selected mycobacteria Protein structure:
Search for Homologs in PDB Top 10 Homologs in PDB (as of Nov 2020): PDB aa ident species PDB title 5V93 100% Mycobacterium tuberculosis Cryo-EM structure of the 70S ribosome from Mycobacterium tuberculosis bound with Capreomycin 6DZI 97% Mycobacterium smegmatis (strain ATCC 700084 / mc(2)155) Cryo-EM Structure of Mycobacterium smegmatis 70S C(minus) ribosome 70S-MPY complex 6DZK 97% Mycobacterium smegmatis (strain ATCC 700084 / mc(2)155) Cryo-EM Structure of Mycobacterium smegmatis C(minus) 30S ribosomal subunit with MPY 5ZEU 97% Mycobacterium smegmatis (strain ATCC 700084 / mc(2)155) M. smegmatis P/P state 30S ribosomal subunit 5ZEP 97% Mycobacterium smegmatis str. MC2 155 M. smegmatis hibernating state 70S ribosome structure 5ZEB 97% Mycobacterium smegmatis str. MC2 155 M. Smegmatis P/P state 70S ribosome structure 5XYU 97% Mycobacterium smegmatis (strain ATCC 700084 / mc(2)155) Small subunit of Mycobacterium smegmatis ribosome 5O61 97% Mycobacterium smegmatis str. MC2 155 The complete structure of the Mycobacterium smegmatis 70S ribosome 5O5J 97% Mycobacterium smegmatis str. MC2 155 Structure of the 30S small ribosomal subunit from Mycobacterium smegmatis 5TCU 76% Staphylococcus aureus (strain NCTC 8325) Methicillin sensitive Staphylococcus aureus 70S ribosome
Links to additional information on rpsJ:
Amino Acid Sequence
VAGQKIRIRLKAYDHEAIDASARKIVETVVRTGASVVGPVPLPTEKNVYCVIRSPHKYKDSREHFEMRTHKRLIDIIDPTPKTVDALMRIDLPASVDVNI
Q
(
Nucleotide sequence available on
KEGG )
Additional Information
MtbTnDB - interactive tool for exploring a database of published TnSeq datasets for Mtb
TnSeqCorr
Rv0700/rpsJ,
gene len: 305 bp, num TA sites: 7
condition dataset call medium method notes
in-vitro DeJesus 2017 mBio growth defect 7H9 HMM fully saturated, 14 TnSeq libraries combined
in-vitro Sassetti 2003 Mol Micro essential 7H9 TRASH essential if hybridization ratio<0.2
in-vivo (mice) Sassetti 2003 PNAS non-essential BL6 mice TRASH essential if hybridization ratio<0.4, min over 4 timepoints (1-8 weeks)
in-vitro (glycerol) Griffin 2011 PPath essential M9 minimal+glycerol Gumbel 2 replicates; Padj<0.05
in-vitro (cholesterol) Griffin 2011 PPath essential M9 minimal+cholesterol Gumbel 3 replicates; Padj<0.05
differentially essential in cholesterol Griffin 2011 PPath NO (LFC=0.0) cholesterol vs glycerol resampling-SR YES if Padj<0.05, else not significant; LFC<0 means less insertions/more essential in cholesterol
in-vitro Smith 2022 eLife non-essential 7H9 HMM 6 replicates (raw data in Subramaniam 2017, PMID 31752678)
in-vivo (mice) Smith 2022 eLife non-essential BL6 mice HMM 6 replicates (raw data in Subramaniam 2017, PMID 31752678)
differentially essential in mice Smith 2022 eLife NO (LFC=0.0) in-vivo vs in-vitro ZINB YES if Padj<0.05, else not significant; LFC<0 means less insertions/more essential in mice
in-vitro (minimal) Minato 2019 mSys essential minimal medium HMM
in-vitro (YM rich medium) Minato 2019 mSys growth defect YM rich medium HMM 7H9 supplemented with ~20 metabolites (amino acids, cofactors)
differentially essential in YM rich medium Minato 2019 mSys NO (LFC=0.0) YM rich vs minimal medium resampling
Analysis of Positive Selection in Clinical Isolates
*new*
data from Culviner et al (2025) (55,259 Mtb clinical isolates)
overall pN/pS for Rv0700: 0.466063593
lineage-specific pN/pS in L1: 0.487036455
lineage-specific pN/pS in L2: 0.531312496
lineage-specific pN/pS in L3: 0.607214282
lineage-specific pN/pS in L4: 0.375044115
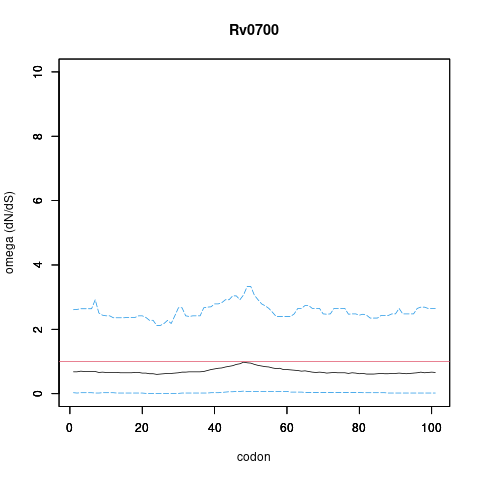
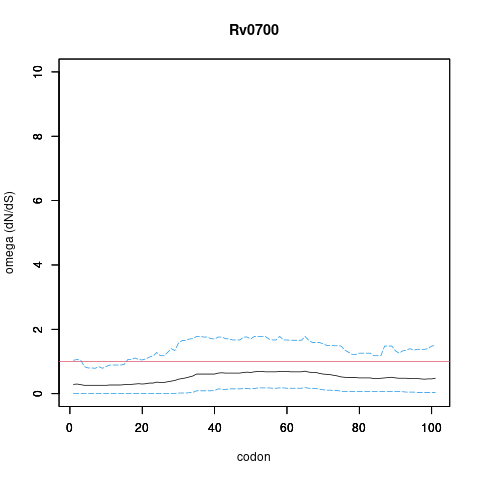
Analysis of dN/dS (omega) in two collections of Mtb clinical isolates using GenomegaMap (Window model) (see description of methods )
Moldova: 2,057 clinical isolates
global set: 5,195 clinical isolates from 15 other countries
In the omega plots, the black line shows the mean estimate of omega (dN/dS) at each codon, and the blue lines are the bounds for the 95% credible interval (95%CI, from MCMC sampling).
A gene is under significant positive selection if the lower-bound of the 95%CI of omega (lower blue line) exceeds 1.0 at any codon.
Moldova (2,057) global set (5,195)
under significant positive selection? NO NO
omega peak height (95%CI lower bound) 0.98 (0.08) 0.7 (0.19)
codons under selection
omega plots
genetic variants* link link
statistics at each codon link link
* example format for variants: "D27 (GAC): D27H (CAC,11)" means "Asp27 (native codon GAC) mutated to His (codon CAC) in 11 isolates"
TnSeq Data No data currently available.
No TnSeq data currently available for this Target.
RNASeq Data No data currently available.
No RNA-Seq data currently available for this Target.
Metabolomic Profiles No data currently available.
No Metabolomic data currently available for this Target.
Proteomic Data No data currently available.
No Proteomic data currently available for this Target.
Regulatory Relationships from Systems Biology
BioCyc
Gene interactions based on ChIPSeq and Transcription Factor Over-Expression (TFOE) (Systems Biology )
NOTE:
Green edges represent the connected genes being classified as differentially essential as a result of the middle gene being knocked out. These interactions are inferred based on RNASeq.
Interactions based on ChIPSeq data
RNA processing and modification
Energy production and conversion
Chromatin structure and dynamics
Amino acid transport and metabolism
Cell cycle control, cell division, chromosome partitioning
Carbohydrate transport and metabolism
Nucleotide transport and metabolism
Lipid transport and metabolism
Coenzyme transport and metabolism
Translation, ribosomal structure and biogenesis
Cell wall/membrane/envelope biogenesis
Replication, recombination and repair
Posttranslational modification, protein turnover, chaperones
Secondary metabolites biosynthesis, transport and catabolism
Inorganic ion transport and metabolism
General function prediction only
Intracellular trafficking, secretion, and vesicular transport
Signal transduction mechanisms
Differentially expressed as result of RNASeq in glycerol environment (Only top 20 genes shown sorted by log fold change with p_adj 0.05).
Conditionally essential as result of TNSeq (Only top 20 genes shown sorted by log fold change with p_adj 0.05).
Binds To:
No bindings to other targets were found.
Bound By:
No bindings from other targets were found.
Binds To:
No bindings to other targets were found.
Bound By:
Upregulates:
Does not upregulate other genes.
Upregulated by:
Not upregulated by other genes.
Downregulates:
Does not downregulate other genes.
Downregulated by:
Not downregulated by other genes.
Property Value Creator Evidence PMID Comment
Interaction PhysicalInteraction Rv2533c priyadarshinipriyanka2001 IDA Structural AnalysisB. Gopal, LF. Haire et al. The crystal structure of NusB from Mycobacterium tuberculosis. Nat. Struct. Biol. 2000
Interaction PhysicalInteraction Rv2533c priyadarshinipriyanka2001 IDA Structural AnalysisB. Gopal, RA. Cox et al. Crystallization and preliminary X-ray diffraction studies on the N-utilizing substance-B (NusB) from Mycobacterium tuberculosis. Acta Crystallogr. D Biol. Crystallogr. 2000
Interaction PhysicalInteraction Rv0709 ravirajsoni IEP Co-expression (Functional linkage)authors,R. Wang,JT. Prince,EM. Marcotte Mass spectrometry of the M. smegmatis proteome: protein expression levels correlate with function, operons, and codon bias. Genome Res. 2005
Interaction PhysicalInteraction Rv0708 ravirajsoni IEP Co-expression (Functional linkage)authors,R. Wang,JT. Prince,EM. Marcotte Mass spectrometry of the M. smegmatis proteome: protein expression levels correlate with function, operons, and codon bias. Genome Res. 2005
Interaction PhysicalInteraction Rv0707 ravirajsoni IEP Co-expression (Functional linkage)authors,R. Wang,JT. Prince,EM. Marcotte Mass spectrometry of the M. smegmatis proteome: protein expression levels correlate with function, operons, and codon bias. Genome Res. 2005
Interaction PhysicalInteraction Rv0705 ravirajsoni IEP Co-expression (Functional linkage)authors,R. Wang,JT. Prince,EM. Marcotte Mass spectrometry of the M. smegmatis proteome: protein expression levels correlate with function, operons, and codon bias. Genome Res. 2005
Interaction PhysicalInteraction Rv0703 ravirajsoni IEP Co-expression (Functional linkage)authors,R. Wang,JT. Prince,EM. Marcotte Mass spectrometry of the M. smegmatis proteome: protein expression levels correlate with function, operons, and codon bias. Genome Res. 2005
Citation mosR, a novel transcriptional regulator of hypoxia and virulence in Mycobacterium tuberculosis. B. Abomoelak, EA. Hoye et al. J. Bacteriol. 2009 ashwinigbhat IEP 19648248 DNA Microarray Analysis
Interaction Regulatory Rv0348 ashwinigbhat IEP DNA Microarray AnalysisB. Abomoelak, EA. Hoye et al. mosR, a novel transcriptional regulator of hypoxia and virulence in Mycobacterium tuberculosis. J. Bacteriol. 2009
Interaction Regulatory Rv0703 ravirajsoni IPI ChIP (Physical interaction)authors,S. Rodrigue,J. Brodeur,PE. Jacques,AL. Gervais,R. Brzezinski,L. Gaudreau Identification of mycobacterial sigma factor binding sites by chromatin immunoprecipitation assays. J. Bacteriol. 2007
Interaction RegulatedBy Rv0348 yamir.moreno IEP Microarrays. mRNA levels of regulated element measured and compared between wild-type and trans-element mutation (knockout, over expression etc.) performed by using microarray (or macroarray) experiments.. qRT-PCR. mRNA expression levels of regulated element measured and compared between wild-type and trans-element mutation (knockout, over expression etc.) performed by using qRT-PCR technique.B. Abomoelak, EA. Hoye et al. mosR, a novel transcriptional regulator of hypoxia and virulence in Mycobacterium tuberculosis. J. Bacteriol. 2009
Interaction RegulatedBy Rv0348 yamir.moreno IEP Microarrays. mRNA levels of regulated element measured and compared between wild-type and trans-element mutation (knockout, over expression etc.) performed by using microarray (or macroarray) experiments.. qRT-PCR. mRNA expression levels of regulated element measured and compared between wild-type and trans-element mutation (knockout, over expression etc.) performed by using qRT-PCR technique.B. Abomoelak, EA. Hoye et al. mosR, a novel transcriptional regulator of hypoxia and virulence in Mycobacterium tuberculosis. J. Bacteriol. 2009
Interaction RegulatedBy Rv1221 yamir.moreno IEP Microarrays. mRNA levels of regulated element measured and compared between wild-type and trans-element mutation (knockout, over expression etc.) performed by using microarray (or macroarray) experiments..R. Manganelli, MI. Voskuil et al. The Mycobacterium tuberculosis ECF sigma factor sigmaE: role in global gene expression and survival in macrophages. Mol. Microbiol. 2001